


![]()
What we have seen in the markets over the past week is historic. We will be talking about this for years to come. Trump’s tariff policy rollout will be discussed alongside other major stock market shocks, such as the COVID-19 crisis and 9/11. Regardless of one’s opinion on the policy itself, shocks like this from our government are not something we are accustomed to. Historically, we have known the government to (at least attempt to) put out fires, not start them.
The magnitude of this uneasiness is illustrated by our Economic Policy Uncertainty Index.
 Source: Ned Davis Research
The current level of policy uncertainty is similar to what we saw in 2020 and 2008. In both of those instances, the government was stepping in to rescue the economy, rather than announcing a change to long-standing business policy. In hindsight, it’s not surprising that the shock and awe of the newly announced tariffs caused panic. The onerous nature of these tariffs was unrealistic and was certain to have both intended and unintended negative consequences.
With recession fears suddenly sparked, the market experienced a significant selloff. Selloffs of this magnitude over such a short time are known as “waterfall declines.” Believe it or not, we haven’t had many of these throughout history. This is the 15th selloff of this scale, in this time frame, since 1929. We’ve seen a retreat of about 18% since late January, while the average waterfall decline is about 24% over a span of 40 days.

The good news is that, following every waterfall decline, the market has recovered—and the recovery is typically measured in months, not years. The rebound can be choppy and may even include a retest of the lows, but the market does recover in a relatively short period.
Another sign pointing to brighter days ahead is our sentiment indicator. While fears have somewhat subsided, fear levels remain elevated.
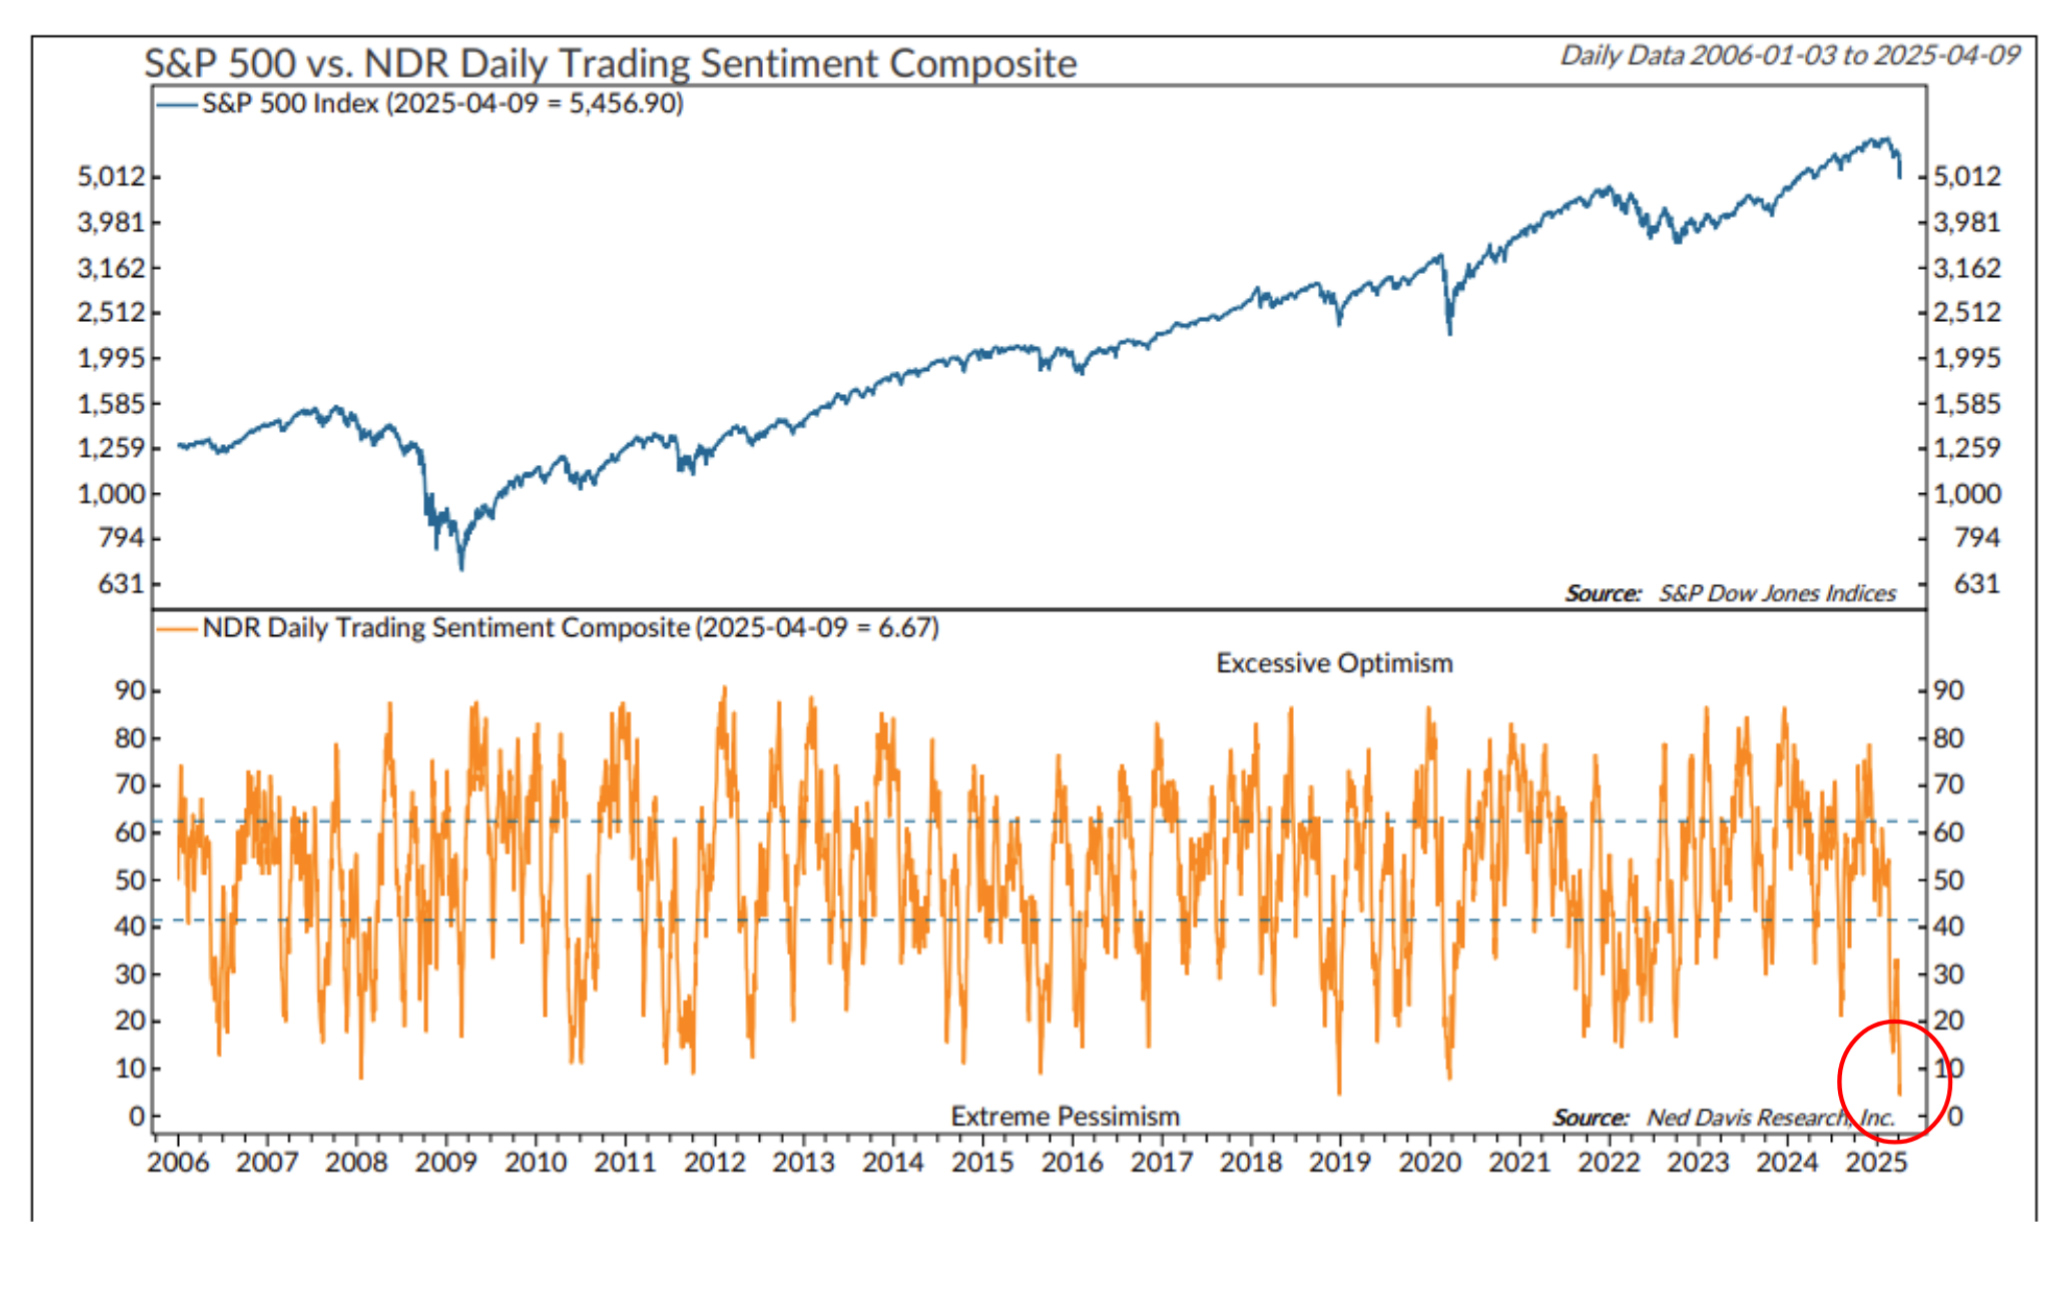
Since late February, our sentiment reading has been in “Extreme Pessimism,” currently sitting at a dismal 6.67. The silver lining is that these are contrary indicators—meaning that the lower the reading, the better the forward returns. Since 1994, when the reading has landed in the “Extreme Pessimism” range, forward returns have averaged 26.04%.
As always, feel free to reach out to me or our team with any questions or comments at t.moore@mooreinvested.com.
Sincerely,
Tom Moore, CFP®
Tom Moore, CFP®

________________________________________
Our mailing address is:
2827 Peachtree Rd NE, Suite #510
Atlanta, GA 30305
(404) 905-2290